Widgets
Settings reference for all ten widget types.
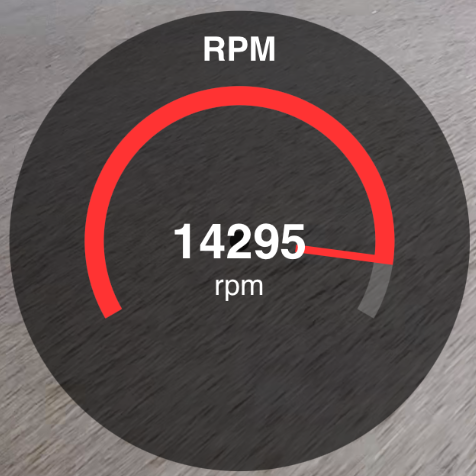
Arc Gauge
Displays a telemetry value as a sweeping arc with needle indicator. Common for speed and RPM.
| Setting | Description | Default |
|---|---|---|
| Data Source | Telemetry channel (speed, RPM, throttle, brake) | Speed |
| Min / Max | Scale range for the arc | Auto-detected from data |
| Label | Text label below the gauge | Channel name |
| Color | Accent color for the arc fill | #ff3333 (red) |
| Style | Solid color or gradient fill | Solid |
| Gradient Colors | Low / Mid / High colors (gradient mode only) | Green / Yellow / Red |
| Inner Text Scale | Size multiplier for the value text (0.5 - 2.0) | 1.0 |
| Show Label | Toggle label visibility | On |
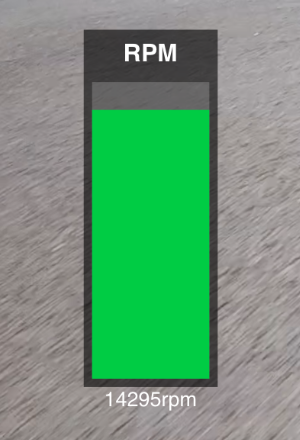
Bar Gauge
Displays a telemetry value as a vertical bar. Ideal for throttle and brake percentage.
| Setting | Description | Default |
|---|---|---|
| Data Source | Telemetry channel | Throttle |
| Min / Max | Scale range | 0 / 100 |
| Label | Text label | Channel name |
| Color | Bar fill color | #00cc44 (green) |
| Style | Solid or gradient | Solid |
| Gradient Colors | Low / Mid / High (gradient only) | Green / Yellow / Red |
| Show Label | Toggle label | On |
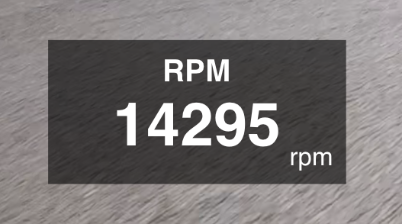
Numeric Display
Shows a telemetry value as plain text — a large number with unit. Compact and minimal.
| Setting | Description | Default |
|---|---|---|
| Data Source | Telemetry channel | Speed |
| Label | Text label above the value | Channel name |
| Color | Text color | #ffffff (white) |
| Unit | Display unit suffix | From telemetry |
| Show Label | Toggle label | On |
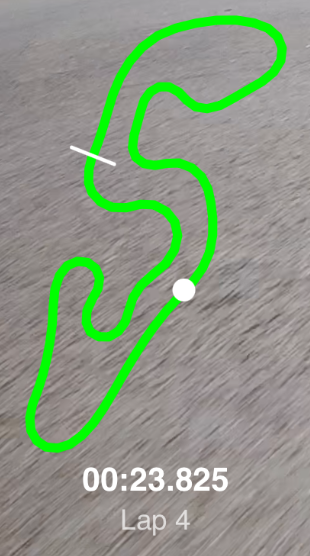
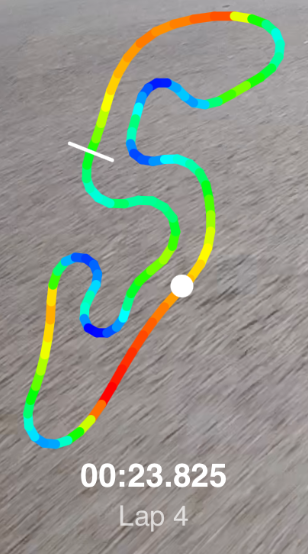
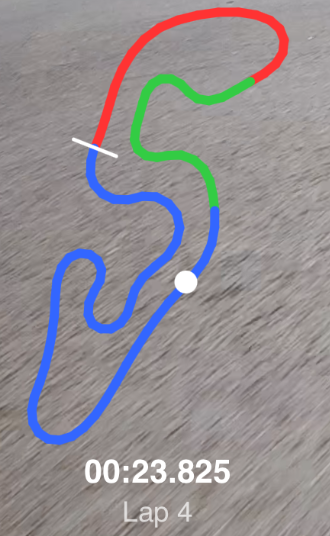
Mini-Map (GPS Track)
Renders the GPS track on a small map with the current position dot. Requires GPS coordinates from telemetry.
| Setting | Description | Default |
|---|---|---|
| Lap | Which lap to draw (All, or a specific lap number) | Lap 2 |
| Track Width | Line width in pixels | 12 |
| Color | Track line color (static mode) | #00ff00 (green) |
| Color Mode | Static, Speed gradient, or Sector colors | Static |
| Dot Color | Current position dot color | #ff0000 (red) |
| Show Background | Dark translucent background behind the track | Off |
| Show Lap Info | Display current lap number and time | On |
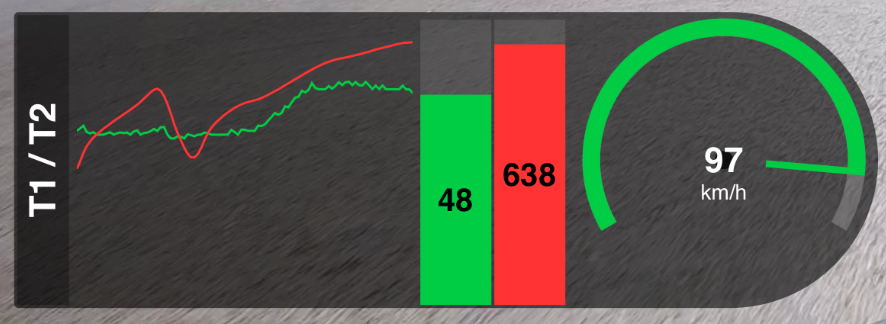
Telemetry Trace
Scrolling line graph (or vertical bar) showing a telemetry channel over time. Can overlay throttle and brake traces.
| Setting | Description | Default |
|---|---|---|
| Data Source | Primary telemetry channel | Speed |
| Window Size | Time window in seconds | 10 |
| Line Width | Trace line thickness | 2 |
| Throttle Overlay | Secondary trace for throttle | None |
| Brake Overlay | Secondary trace for brake | None |
| Mini Gauge | Secondary gauge display | None |
| Vertical Label | Rotated text on left edge | TELEMETRY |
| Show Label | Toggle vertical label strip | On |
| Show Bar Values | Show value inside bar fill (bar mode) | On |
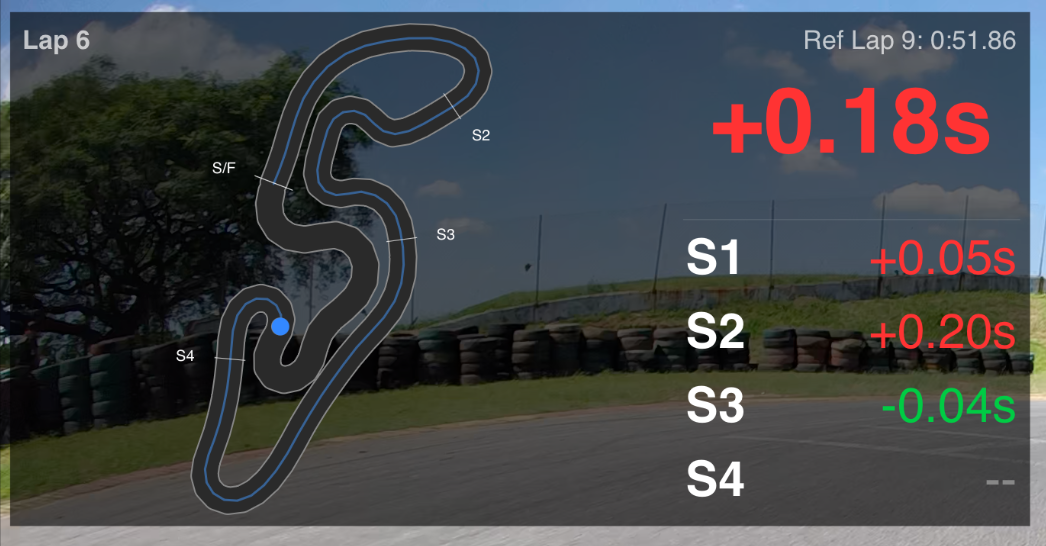
Ghost Lap
Compares current lap performance against a reference lap. Shows position delta on the track and optional speed comparison trace.
| Setting | Description | Default |
|---|---|---|
| Current Lap | Lap to track (Auto-follow or specific number) | Auto-follow |
| Reference Lap | Lap to compare against | Fastest lap |
| Show Comparison Trace | Bottom strip with speed overlay | Off |
| Comparison Channel | Metric for the trace line | Speed |
| Color | Widget accent color | #3388ff (blue) |
Image Overlay
Places a static image (logo, sponsor badge, watermark) on the canvas. Supports PNG, JPG, and other standard formats.
| Setting | Description | Default |
|---|---|---|
| Image Path | Filesystem path to the image file | (none) |
| Opacity | Transparency level (0 = invisible, 1 = fully opaque) | 1.0 |
| Size | Widget bounding box (drag to resize) | 15% x 15% of canvas |
Static Text
Renders user-entered text on the canvas. No telemetry required — works in any project type, including plain multi-cam edits.
| Setting | Description | Default |
|---|---|---|
| Text | Single-line text shown on the canvas | (empty) |
| Font Size | Size multiplier for the text (0.5x – 2.0x) | 1.0x |
| Background Opacity | Translucent backdrop behind the text (0 – 100%) | 45% |
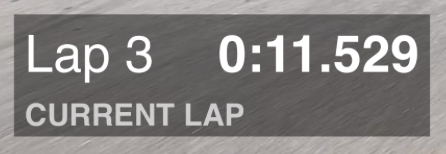
Lap Time Indicator
Shows lap number and lap time in M:SS.mmm format for the current, best, or last lap. Each instance is locked to a single mode — drop several side by side to compare modes in real time.
| Setting | Description | Default |
|---|---|---|
| Mode | Current Lap, Last Lap, or Best Lap | Current Lap |
| Background Opacity | Translucent backdrop (0 – 100%) | 45% |
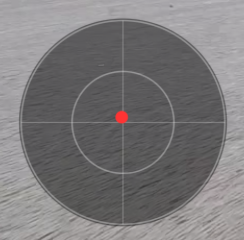
G-Force
2D traction circle showing the vehicle's lateral and longitudinal acceleration as a moving dot inside concentric 1G and 2G reference rings, with crosshair quadrant lines splitting brake/accel and left/right.
| Setting | Description | Default |
|---|---|---|
| X-Axis (Lateral) | Telemetry column for horizontal G (left = negative, right = positive) | gforce_x |
| Y-Axis (Longitudinal) | Telemetry column for vertical G (braking pushes the dot down) | gforce_y |
| Max G | Outer-ring scale (0.5g – 5.0g) | 2.0g |
| Background Opacity | Translucent backdrop, clipped to the circle (0 – 100%) | 45% |
gforce_x/gforce_y or vendor-prefixed equivalents), the widget renders an empty traction-circle placeholder — rings and crosshair only — instead of drawing NaN-derived geometry.